Do you want to check error logs in Azure portal and are wondering how to do it? Well, you have landed at the right place. In this article, let us see how to check error logs in Azure portal.
Azure is a platform for cloud computing and an online portal that you may use to access and administer Microsoft’s cloud resources and services. Depending on your needs, these services and resources may store and alter your data. A feature of Azure Monitor called Azure Monitor Logs gathers and arranges performance and log information from resources that are being monitored.
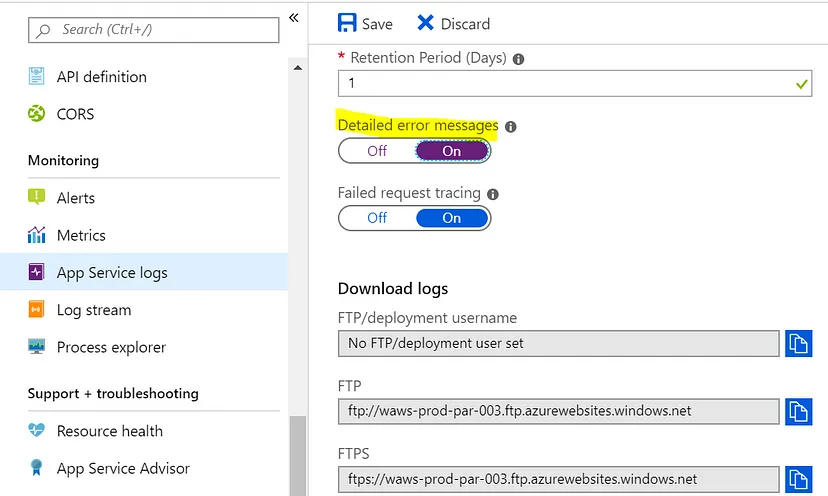
To check error logs in Azure portal in detailed error logging, Go to your app > Choose App service logs > Choose ON > Click Save.
Continue reading further to understand in detail how to check error logs in Azure portal and what steps are involved in it.
How To Check Error Logs In Azure Portal?
To check error logs in Azure portal on diagnostic logs, Go to Diagnostic settings window > Select Archive > Pick a storage account > Choose the logs you want to enable > Click the On button > Click Save
An alternative to command-line tools is the web-based, unified console known as the Azure portal. Through the Azure site, you may manage your Azure subscription. Azure portal is used in data and analytics, hybrid cloud and infrastructure and more. It is important to check error logs in Azure portal as it provides details on what happened, when it happened, how important it was, and perhaps even what the reason was. The simplest way to identify the cause of an application outage or performance problem is to check the error log and error messages which can be performed by a few methods.
1. Detailed Error Logging
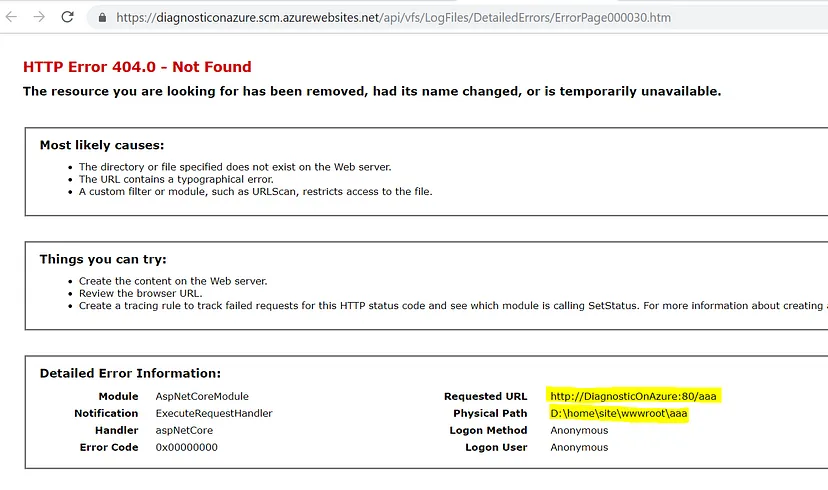
When an error occurs with a code of 400 or higher, the server often displays these HTML pages to the user. 50 mistakes are retained at most and the oldest 26 are automatically eliminated after this point. When your website answers with an error notice, a detailed version of the html files is generated. This log type, which is kept on the website’s file system, is useful for enabling debugging for some problem answers. These logs have a .htm extension and indicate failure in your web app. To turn on the following setting in the Azure interface, enable and check error logs in Azure portal:
Step 1: Go to your app and choose App Service logs from the menu.
Step 2: Choose On, followed by Save, under Detailed Error Logging.
Also Read: What Is the Cloud and How Can It Help Your Company?
2. Failed Request Tracing
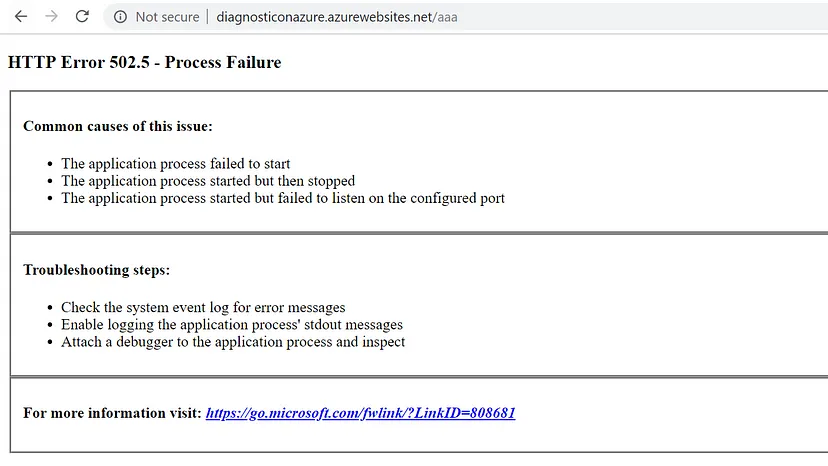
When one of the modules involved in processing a request is taking a long time or an error occurs at some point, request traces are highly helpful. FREB, or Failed Request Tracing will provide you with detailed information from IIS via its many stacks for each unsuccessful request. These log files are also kept on the website’s file system. For most uses, it is too detailed. But, this is the log to look at if you need to dig in and want to examine every stage of a failed HTTP request.
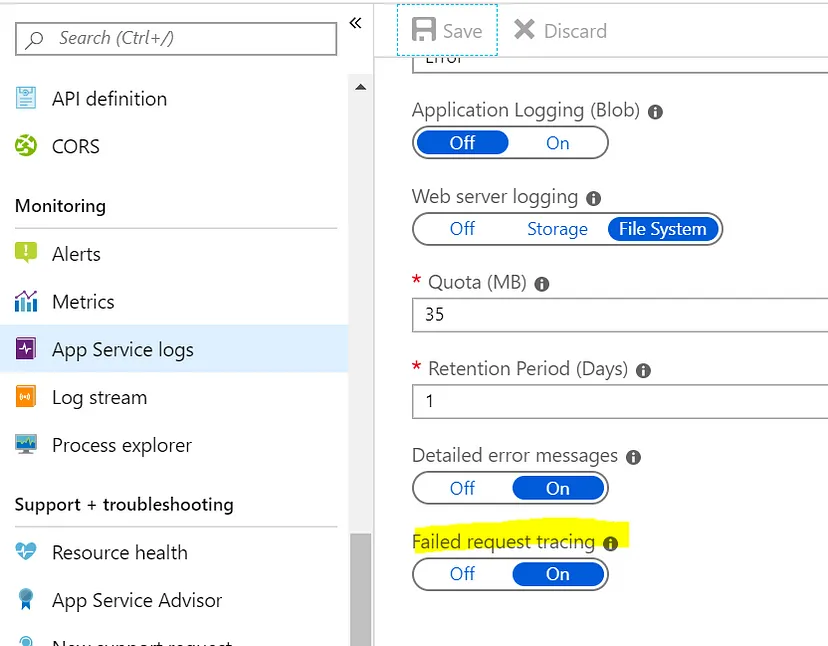
By default, the Failed Request Tracing feature logs all unsuccessful requests with HTTP status codes between 400 and 600. The App Service file system has both detailed error logging and failed request tracing log files. You must turn on the following setting in the Azure interface to enable and check error logs in Azure portal. To do so:
Step 1: Go to your app and choose App Service logs from the menu.
Step 2: Choose On, followed by Save, under Failed Request Tracing.
3. Diagnostic Logs
You can activate and see diagnostic logs for your Azure resources using Azure Monitor. Log analytics workspaces can receive diagnostic logs from the Azure Application Gateway. This capability is crucial for doing performance checks, identifying faults, and undertaking troubleshooting procedures. You can also get information about:
- Access logs for Application Gateway show client and server issues.
- Hourly requests for every Application Gateway
- Hourly failure rates for each Application Gateway
- User agent errors for Application Gateways
Also Read: How To Download Adobe Creative Cloud Download On Mac?
To check error logs in Azure portal follow these steps:
Select Monitor > Go to Azure monitor > Click Diagnostic logs > Choose subscription and other details > Turn on diagnostics to configure logging.
Step 1: By selecting “Monitor” from the list of choices in the far-left window, you can go to Azure Monitor.
Step 2: Click Diagnostic logs under “Explore” in the Monitor – Activity log panel.
Step 3: Choose a Subscription, Resource group, Resource type, and Resource to display diagnostic logs for using the drop-down choices at the top of the Monitor – Diagnostic logs panel.
Step 4: To configure logging, select the “Turn on diagnostics” to gather the following logs link if diagnostic logging is deactivated.
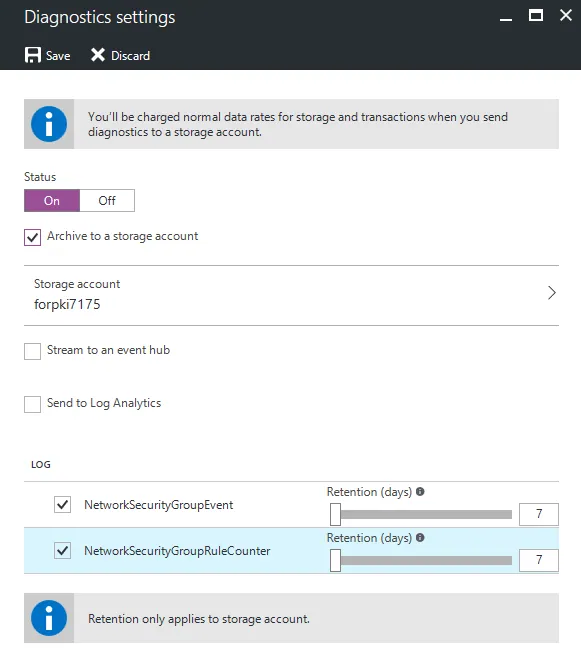
Use Azure Monitor’s diagnostic logging feature
Step 1: In the Diagnostic settings window, select Archive to a storage account, and pick a storage account.
Step 2: Choose the logs you want to enable under the Logs section.
Step 3: Then, click the On button.
Step 4: To complete the procedure, click Save.
The Diagnostic logs pane will display a list of logs that you may easily download if diagnostic logs are being kept in a storage account. For each Azure resource, diagnostic logs can be individually enabled or disabled.
Wrapping Up
We have come to the end of the post and we hope this article has given you a clear explanation on how to check error logs in Azure portal. For more such informative and interesting articles check out our website at Deasilex.
Frequently Asked Questions
Q1. What Is Azure Portal Used For?
- Internet of Things. Connect, monitor, and control devices with secure, scalable, and open edge-to-cloud solutions
- Security and governance
- Application development
- AI
Q2. How Do I Connect To Azure Portal?
Ans. To connect to a VM, go to the Azure site. Choose virtual machines by performing a search. From the list, choose the desired virtual machine. Choose Connect at the top of the virtual machine page.
Q3. How Do I Collect Logs In Azure?
- Choose Log Analytics workspaces > your workspace from the Azure portal.
- Make sure to choose Legacy custom logs under the Classic option.
- Every configuration modification is automatically pushed to every agent by default.
Q4. How Do I Check Audit Logs In Azure Portal?
Ans. Log in to the Azure portal, navigate to Azure AD, and choose Audit log under Monitoring. Moreover, you can use the Microsoft Graph API to view the audit log.
Q5. What Is The Use Of Azure Logs?
Ans. The Azure portal includes a function called Log Analytics. Use it to edit, run, and interactively examine log queries’ outcomes. These queries can subsequently be used to support other Azure Monitor capabilities like workbooks and log query alerts.

