
Be it business meetings or our school presentation, pie charts provide the best visuals to the data that we want to present or share. It becomes easier to understand the data when presented through colored lined graphs. Do you know How to make a double line graph in google sheets and edit them?
Well, it’s pretty simple and easy! You can do this in many ways. Either use the regular method and create the line graph using spreadsheets or you can also create a line graph via Google Docs. You can link your doc file with the spreadsheet document to enjoy the privilege of both in one place.
Learn how to make a double line graph in google sheets with a step-by-step pictorial guide mentioned below. You’ll find a separate guide for Mac, PC, and Chromebook users as well. Ready to find out how it’s done? Well, don’t skip any step then!!
How To Make A Double Line Graph In Google Sheets?
Making a graph be it a single line or double line is very simple. You just need to add your data right so that your graph contains the correct information. You can use this graphical document for a presentation, for school projects, for business proposals, and for so many other things.
Follow these steps to create your own double line graph using spreadsheets:
1. Go to Google Drive from your laptop. From Drive click on new
2. Click on the “New” option from the drive.
Want to include drawing figures in your doc file? Here check out How to Draw on Google Docs | Simple Google Hacks!!
3. A drop-down menu will pop up on the screen. From there click on “Google Sheets.”
4. Now, fill the sheet accordingly. Change the title. Fill the column “A”.
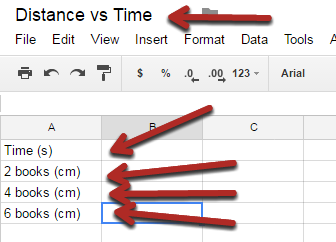
5. Now fill the other “Time and Distance” columns.
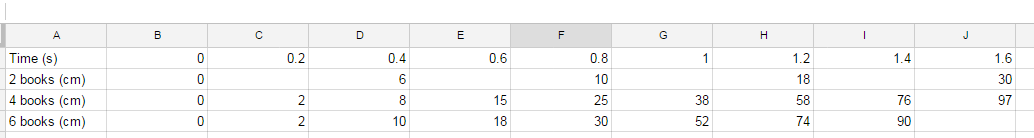
6. Select the whole data that you filled in the spreadsheet.
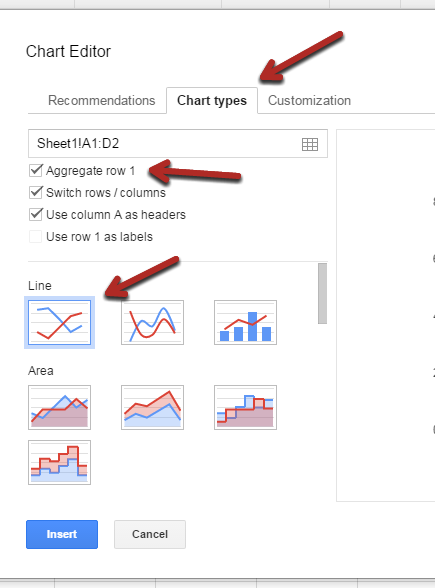
7. At the top right corner, click on the “chart” icon.

8. You’ll be provided with different chart types from where you can select the type of graph that you want to insert for your document.
9. Next you need to tap on “customize” and fill in the details like Title.

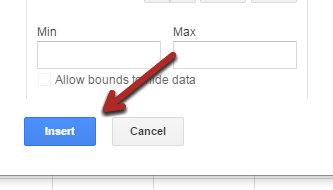
10. Scroll down and click on the “Horizontal” option by clicking the “Axis” option, and then change the title.
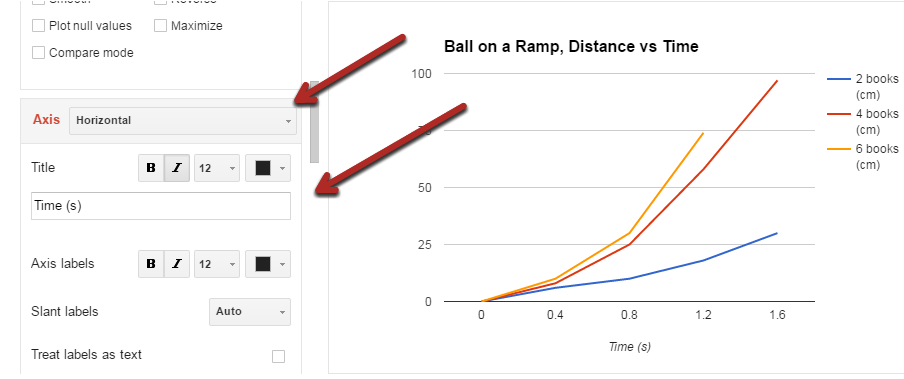
11. Change the Horizontal setting to “left vertical” and then enter the title.
Use selector triangle to change to Left verticle & enter title
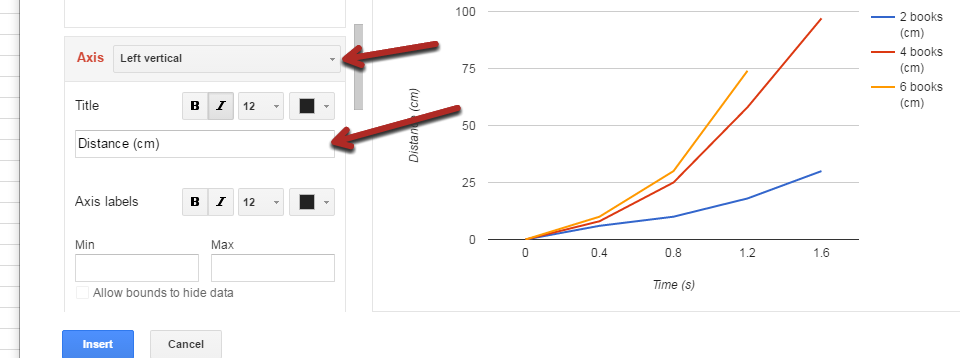
12. When you have entered the title, don’t forget to hit the “Insert” tab at the bottom of the screen.
13. From the small selector triangle option at the right corner, select the “Move to own sheet” option.

14. Come back to the sheet and click on the “file” option from the top left corner of the sheet. There you’ll find the “print” option. Click on it.
It’s done!!!
How To Create A Line Graph In Google Docs On Chromebook, Mac, or PC?
Google docs have these inbuilt options to add graphs and edit them in the doc itself. To do this you need to combine your google doc and google sheets documents.
Follow these simple steps to create a line graph in google docs:
Step 1: Create the Chart
1. Open your Google Docs and open a blank docs file.
2. At the top left corner, click on the “File” option.
3. Now select the “new” option from the drop-down menu.
4. From there, you’ll find the “spreadsheet” option, click on it.
5. A new spreadsheet will open up. Add the data you want to fill in your graph.
6. Now tap on the individual cell that contains your data, and go to the “Insert” option from the menu bar.
7. From there, select the “chart” option.
8. This will automatically convert the selected data into a chart.
Step 2: Copy Your Chart
For Mac users, CMD+C keys will copy the chart. For Windows users, you can use CTRL +C options for copying the graph.
Step 3: Paste Your Graph
To paste your graph in google docs, you need to return back to the doc file. To paste your graph in the doc file, click CTRL+V, and the graph will be pasted to your docs.
Now, here’s a twist!!
You can either link the spreadsheet to your docs or use it without linking to the docs.
When you link the spreadsheet and docs together, you can make changes from the sheet and they will be added to docs as well, but if the documents are not linked together, then you might have to make the changes separately in the doc file as well.
Step 4: Modifying The Chart Type
Your graph surely needs some modifications. To modify your graph in google docs you need to follow a few simple steps:
1. Tap the graph that you have created on your doc file so that it becomes highlighted.
2. Now press the “Link” icon at the top of the graph.
3. A drop-down menu box will appear. From there select the “Open source” option.
4. Now you need to open the “Editor” to do the further changes in your graph. This can be done by clicking three lines present at the top right corner of the screen, or you can simply double click the chart to open the editor.
5. Click on the graph that you wish to make changes on.
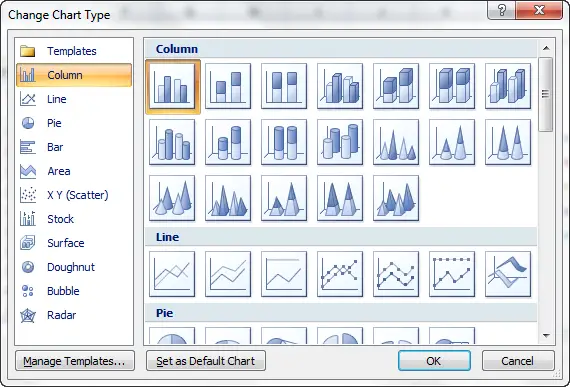
6. Now press the “Setup tab”. This will lead you to the “Chart type” option, click on it.
7. Now select any chart type that goes well with your requirements.
8. Click “Update” to save the changes.
You may also be interested in How To Add Border In Google Docs | 3 Best Ways To Do It!!
How To Make A Line Graph
Great!! You have successfully learned how to add graphs to the docs. Now it’s time to make your own line graph. Follow these steps:
1. It’s a default feature in google docs that your chart automatically gets saved in the best default chart type. But if you wish to change it to a different line graph, the process remains the same as mentioned above.
2. After following all the steps, you need to scroll down to the “line” section and select the chart type you wish to add.
3. Not just the basic line charts, you can choose many other, smooth lines charts, etc.
How To Make A Bar Graph
1. Like we did in the previous two sections, once again you need to repeat the steps to create the chart.
2. After completing the above-mentioned steps, When you find the ‘Chart type” option, click on the “Bar” option. Three bars will be shown on your screen. Choose anyone you want.
Editing The Legend
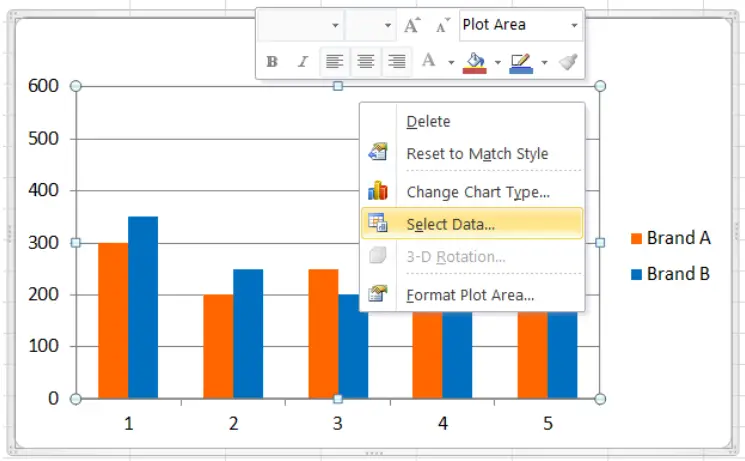
Legends are the visual outlooks of our charts and graphs. You can easily change the chart data outlooks by editing the legends. To do this you need to:
1. Follow the first 7 steps that you followed while creating a line graph, as mentioned above.
2. When you reach the “chart” option, click on the “chart editor” menu. From there go to the “customized” tab.
3. Now, scroll down to find the “legend” option. Click on it.
4. You’ll get multiple options like “position”. This option lets you place the legend to the left, right, above, or below the graph.
5. If you want to remove the legend, you can click on “none”.
6. You can also change the description, size, color, font type of your graph.
Don’t forget to check out How To Do Superscript & Subscript In Google Docs & Mac?
Wrapping Up:
Now that you know how to make a double line graph in google sheets, try these steps and make the desired graph. You can do the desired changes accordingly.
If you found this post helpful, don’t forget to share it with others as well. Also, keep visiting our site for more such editing guides!!
Frequently Asked Questions:
Q. How to create a google sheet graph with multiple lines in the same chart?
You can make a multiple line graph by following these simple steps:
1. Select the cells you want to convert into a graph.
2. Click on the “Insert” option present on the ribbon.
3. Select a “line graph”.
4. Choose “double line graph”.
Featured Image Credits: Online Tech Tips.com